Axis Tactics 19th February, 2025 - Technical Analysis for Major Currencies : GBP/USD ; EUR/USD ; USD/JPY ; USD/CAD ; Gold ; Bitcoin
GBP/USD ; EUR/USD ; USD/JPY ; USD/CAD ; Gold ; Bitcoin
If you already maintain an active portfolio, advisory relationship or trading account with one of our Group Companies, please reach out to your usual contact or otherwise via email on info@axis-im.com, for a full access code to all sections in this Newsletter, inclusive of (i) Pay-Walled content on Specific trade recommendations, (ii) Entry and Exit timings and (iii) Risk Management Parameters.
Access Codes also available for Trusted Media contacts.
For more information on what we do and the services we offer, please visit www.axis-im.com.
Some Charts & Data from Both Internal and Street Sources on Major FX Crosses, Gold & Bitcoin
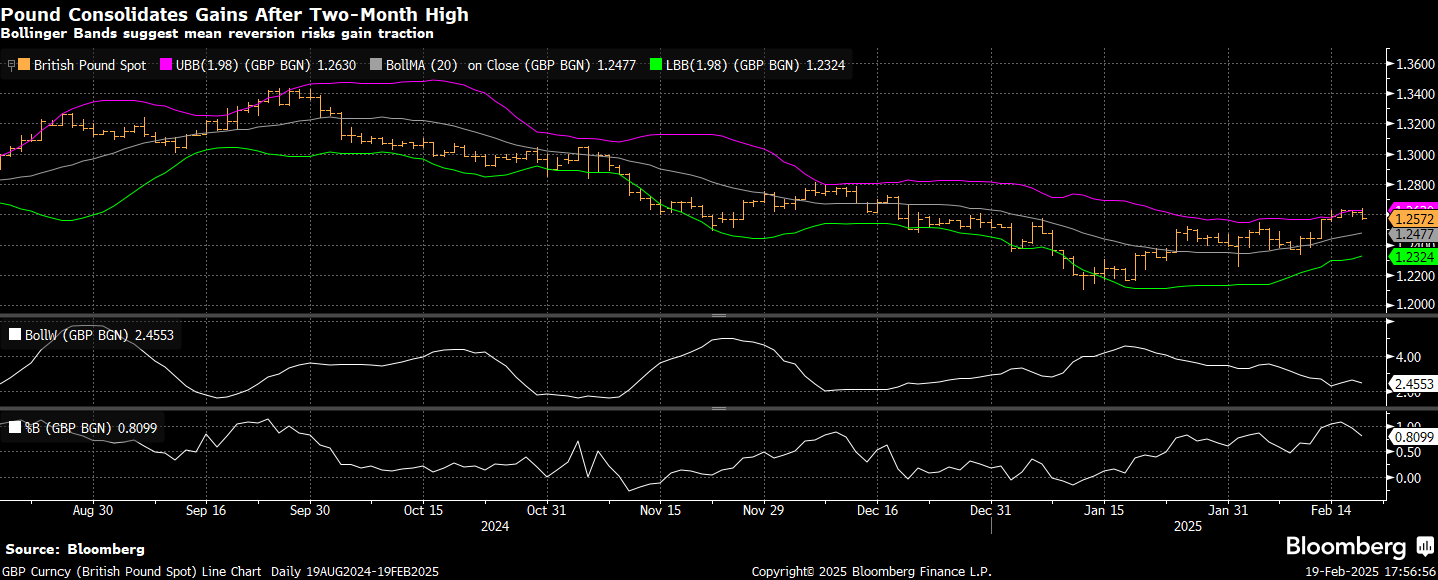
GBP/USD — Pair sets a new YTD high on Wednesday and session high at 1.2640 comes within a whisker of 100-DMA at 1.2659; need a break and close above 100-DMA to confirm further upside ahead. But Bollinger and this 100-DMA are tough obstacles to overcome at the first attempt.
Intraday resistance: 1.2640, session high; weekly resistance: 1.2659, 100-DMA
Spot: 1.2574
Intraday support: 1.2575, weekly support: 1.2333, Feb. 11 low
EUR/USD — Looking more evenly balanced as pair drops for a third day, keeps setting lower lows while managing to hold above its 55-day moving average at 1.0387; YTD high of 1.0533, last seen in January, continues to cap short-term euro gains
Intraday resistance: 1.0461, session high; weekly resistance: 1.0533, Jan. 27 high
Spot: 1.0438
Intraday support: 1.0419, session low; weekly support: 1.0280, Feb. 10 low
USD/JPY — Neutral; pair consolidates below 200-DMA at 152.66 while 55-DMA at 155.35 still acts as near-term resistance; need a daily close above 55-DMA to confirm more upside
Intraday resistance: 152.31, session high; weekly resistance: 154.80, Feb. 12 high
Spot: 151.39
Intraday support: 151.25, session low; weekly support: 150 key level, last breached on Dec. 9
USD/CAD — The pair stays within a broad range defined by 55-DMA at 1.4330 and 100-DMA at 1.4131; also near the bottom of Bollinger band
Intraday resistance: 1.4230, session high; weekly resistance: 1.4330, 55-day moving average
Spot: 1.4229
Intraday support: 1.4176, session low; weekly support: 1.4131, 100-day moving average
Bitcoin vs Gold
This graphic illustrates how any fall in Bitcoin might be accompanied by fresh highs in Gold. That being said, if we find ourselves in extreme margin call territory within major stock indices, correlations often collapse. Bitcoin backing down from $100,000 may be a reason for gold to visit the $3,000 an ounce resistance level. Our graphic shows the ounces of the metal equal to the crypto slipping below last year's high and potentially forming an enduring peak. A Peak in the Bitcoin/gold ratio may have similar implications for the S&P 500 vs Gold ratio.
Trade Recommendations, Entry & Exit Levels and Risk Management Guidance is within the Section below:-
Keep reading with a 7-day free trial
Subscribe to The Axis Tactics Newsletter to keep reading this post and get 7 days of free access to the full post archives.


